


How to get the most out of Sugar reports and dashboards

Hideki E. Hashimura | November 21, 2017
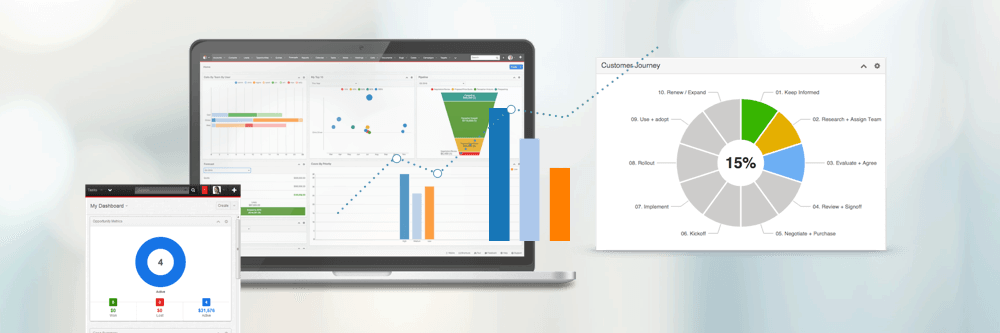
One of the most useful functions of SugarCRM is the capability to create and personalise reports and dashboards. Sugar reports allow you to gather data from various CRM modules in order to create valuable information on accounts, activities, campaigns and more. The Sugar Intelligence Pane dashboard displays dashlets related to history, activity, metrics and other aspects of your business, all of which are customisable. Here are some basic tips for using these features to maximise your knowledge, efficiency and success with SugarCRM.
Develop a clear objective
First and foremost, you must determine what kind of information you want to generate. What will be the most relevant and useful insights for specific people and departments? For example, marketing professionals might need tools to help them keep track of customer response rates, sales and marketing campaigns. Salespeople may be motivated by tools that allow them to compare their performance with their coworkers and see how they measure up. In other words, every employee and department has different needs, and this must be taken into account when creating CRM reports and CRM dashboards.
Design structure in advance
Once you know what kind of information you want, you can decide how many parameters, reports, dashboards and dashlets to create. You need to generate enough information to achieve your goals, but too many report parameters or dashlets can create unnecessary confusion. Keep it simple, and never lose sight of your specific business objectives. Once you have determined the appropriate number of tools, create a simple and specific naming system to maintain clear organisation. This is also a good time to decide which employees will have access to each report and dashboard.
Choose the best report type
After you have determined your objectives, parameters and structure, you can start creating reports. At this point it is vital to choose the CRM report type most appropriate to your needs. SugarCRM offers several options, each suited to certain types of information. For a basic report that can be exported as a .CSV file, create a Rows and Columns report. A Summation report will allow you to view computed data in a chart format, and a Summation with Details report incorporates aspects of the Rows and Columns report as well. Matrix reports provide an overview of computed data in a detailed grid table. Find out more about how to use each CRM report type by consulting Sugar Support.
Choose the most useful dashlets
You can customise the dashlets displayed on each CRM dashboard you create according to its purpose. SugarCRM includes a wide variety of CRM dashlet options to provide insight on all aspects of your business. The default dashboard automatically includes certain dashlets, such as History and Planned Activities. Some other commonly used options are List View (which provides a list of records for a specific module), and Active Tasks/Inactive Tasks (which display tasks that are outstanding and completed, respectively). There are plenty of other useful dashlets to discover, all of which are explained in our guide to the Sugar Intelligence Pane.
Why use reports and dashboards?
Once you know how to make the most of these SugarCRM features, you can expect to see positive long-term results. Sugar users who take full advantage of reports and dashboards will gain a greater understanding of how their company operates over time. By implementing these simple strategies, you can gain insight into customer relationships and activity, while effectively managing your own workflow. Continue to experiment with different types of CRM reports and CRM dashlets to find the configuration that best serves your needs, and do not be afraid to take inspiration from other companies—the best strategies are often those that combine previously proven methods with innovative new ideas.